11th December 2023 marks the one-year anniversary of publishing Marsh Flatts Farm’s heat pump performance data to HeatpumpMonitor.org.
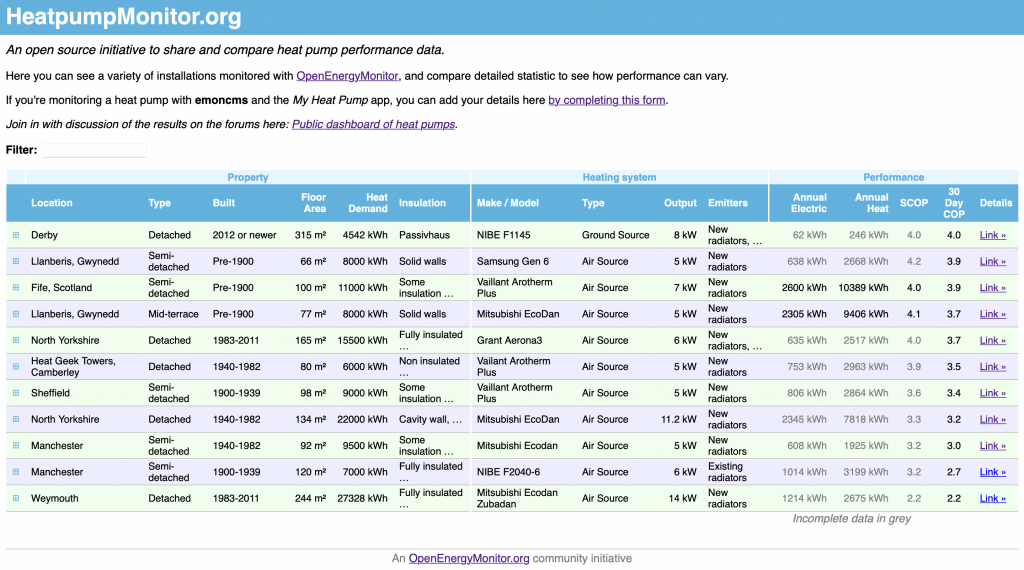
For those not familiar with HeatpumpMonitor.org, it’s an online dashboard showing real-world performance metrics for a range of different heat pump installations – mostly in the UK but with a few in other countries.
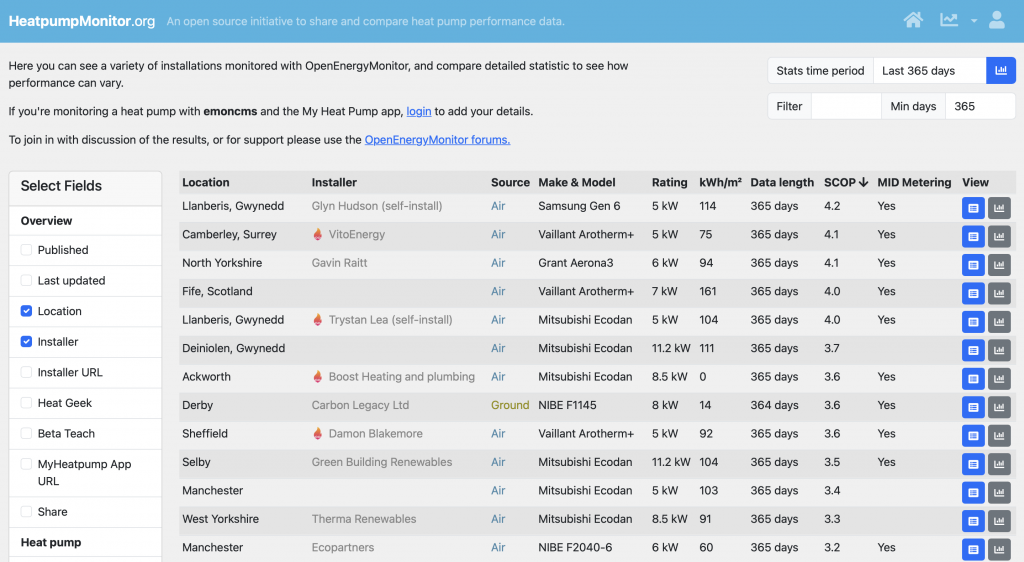
Almost all the installations are Air Source systems and most are Retrofits, replacing gas- or oil-fired boilers. I thought it would be good to contribute a Ground Source system, in a New Build property, for comparison purposes. The main motivation for adding my system was the cold snap forecast for mid-December 2022, with a period of below-freezing temperatures.
From the main page, the Blue icon on each row takes you to a page containing static summary information about each installation, and the Grey icon takes you to the ‘My Heatpump’ App page showing the operational data in a graphical format.
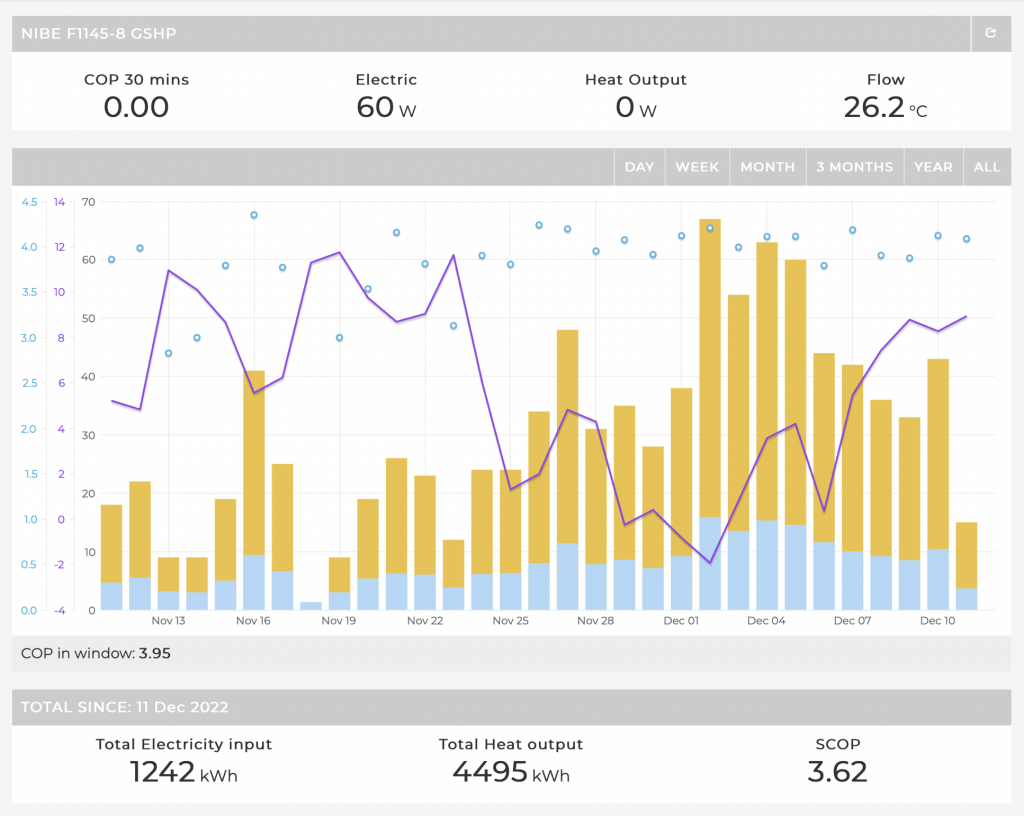
The blue bars are the daily total Electricity Consumption and the yellow bars are the daily total Heat Output. The purple line shows the outdoor temperature (rather more relevant for Air Source systems) and the blue spots are the daily CoP values.
Clicking on one of the daily bars brings up a more detailed view, shown below:
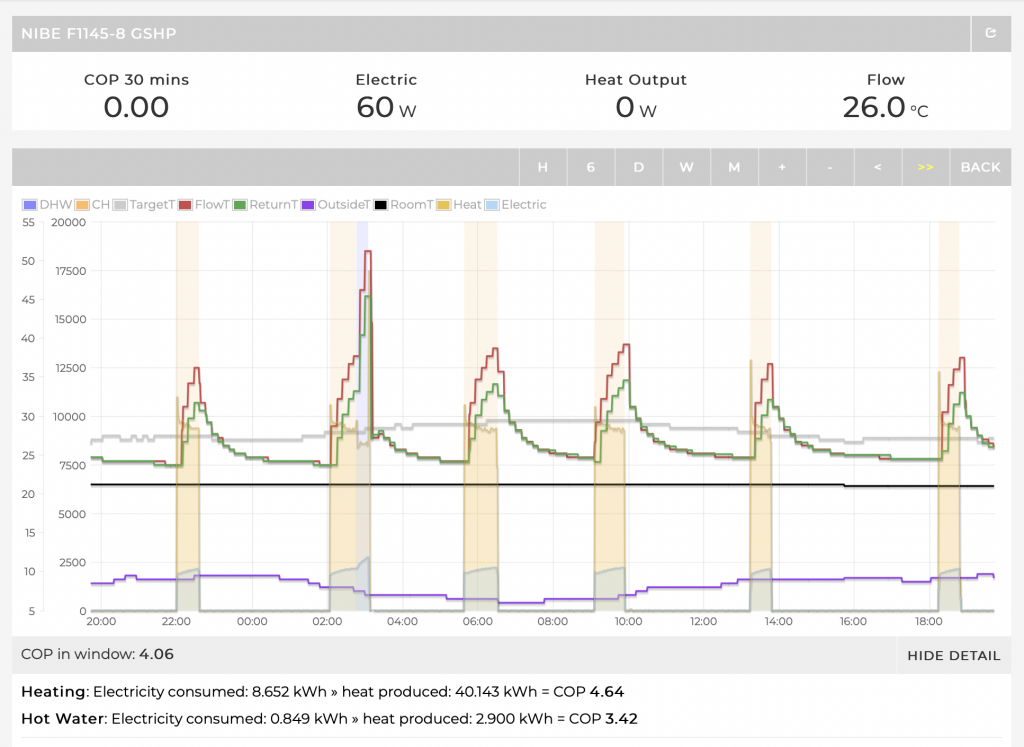
The summary information below the graph is a recent addition, breaking out the different Coefficients of Performance for Hot Water (requiring a higher temperature so rather less efficient) and Central Heating – in both cases excluding the power consumption in ‘standby’.
Key Take-Aways
- In the past year, my system has used 1242 kWh of Electricity to generate 4495 kWh of Heat, giving a Seasonal Coefficient of Performance (SCoP) of 3.62
- I typically pay about 20 pence per kWh of electricity (on the Intelligent Octopus Go tariff, which is 7.5p for 6 hours overnight then 29.78p for the remaining 18 hours)
- That means the annual cost for central heating and hot water is about £250, or less than £1 per square metre of floor space
- Note that about three-quarters of the domestic hot water heating is done by diverting excess solar power generation to the immersion heater, not using the heat pump
- My system’s SCoP is better-than-average but not great
- It is significantly more efficient when it’s moving more heat – and it’s more efficient at the start of the heating season (i.e. November and December) when the ground is still relatively warm
- When switched on without the compressor running (i.e. ‘standby’ mode) it’s consistently drawing 60W, roughly 20W for the circulation pump and 40W for the control system, with no heat output registered on the heat meters (although that heat is still going into the house)
- Because of this, I switch it off completely over the summer months (end of April to end of September) – and these consumption figures reflect that
- It is significantly more efficient when it’s moving more heat – and it’s more efficient at the start of the heating season (i.e. November and December) when the ground is still relatively warm
HeatpumpMonitor.org is thoroughly successful in meeting its stated aim of demonstrating that heat pumps work very successfully in UK properties and in the UK climate. This is real data from real installations, uploaded by real customers without any vested interests.
The associated Open Energy Monitor community forum (that pre-dates HeatpumpMonitor.org, which is a spin-off from the forum rather than the other way around) is full of knowledgeable and helpful people and is well worth a visit.