
This post is a follow-on from Part 1 which reported the experiences at the start of the heating season (at the end of November). After a few months of rather colder temperatures and the extraction of a considerable amount of heat from the ground, the Coefficient of Performance figures are still good but somewhat less impressive than before.
It’s evident that the temperature of the water coming in from the ground loop has a significant effect on the efficiency of the heat pump and the heat output it is able to deliver. At the end of November the ‘brine’ was typically coming in at 10 degrees whereas now it’s around 5 degrees. With brine at 10 degrees, the 8 kW heat pump was actually delivering 10 kW (as reported by the Kamstrup heat meter) whereas with brine at 5 degrees it’s ‘only’ delivering 8.5 kW. The heat pump experts tell me this is expected behaviour and it’s why an ‘open loop’ heat pump taking water from a lake or river performs better than a ‘closed loop’ unit which circulates the same brine around a closed circuit.
The headline performance statistics are now:
- In ‘heating’ mode, the unit is delivering an instantaneous CoP of around 4.25
- In ‘hot water’ mode, the unit is delivering an instantaneous CoP of as little as 2.75
Heating
In ‘heating’ mode the heat pump attempts to match the heat loss from the house by delivering water into the heating circuits at just the right average temperature. With colder temperatures outside this equates to warmer water, which tends to equate to lower efficiency (although actually the high thermal mass of the house reduces the impact of brief cold spells). During a typical ‘run’ it is still consuming almost exactly 2 kW (just like in November) but delivering 8.5 kW, for a CoP of around 4.25.
Hot Water
On cold-but-bright days, the hot water gets heated by the Immersun unit that diverts excess solar PV generation to the immersion heater, which has its thermostat set to 60 degrees. (It does this often enough that I’ve switched off the heat pump’s own anti-legionella sterilization cycle for the hot water tank.) On dull days the heat pump still kicks in to heat the stored hot water to 50 degrees. With the lower brine temperature (5 degrees in, 0 degrees out) it still consumes up to 2.88 kW but wth a reduced power output of 8.0 kW, for a CoP of 2.77.
Performance Graphs
The first set of graphs below are from a sample 24-hour period (2018-02-15T20:00 to 2018-02-16T20:00) which show:
- Some of the heat pump temperatures, as reported by its internal control system
- The heat pump power consumption, as reported by the sub-meter on its electricity input
- The heat pump power output, as reported by the heat meter on the ‘heating’ flow pipe from the heat pump
These graphs also show the ‘cycling’ of the heat pump:
- Overnight, it ran for 20 minutes every 1 – 2 hours
- From 11:00 – 18:00 it shut down completely
- This is because it was a cold but bright day: 0 degrees at 07:30 but then warming to 5 degrees by 11:30 and on to 7 degrees for much of the afternoon
- As the outside temperature rose, the ‘Calculated’ (target) temperature for the heating circuit was reduced
- Also, once the sun made it onto the polished concrete floor slab containing the UFH pipes the UFH stopped calling for heat
- There are floor probes in the concrete slab which control valves on the UFH pipe loops to maintain the temperature of the slab at 23 degrees
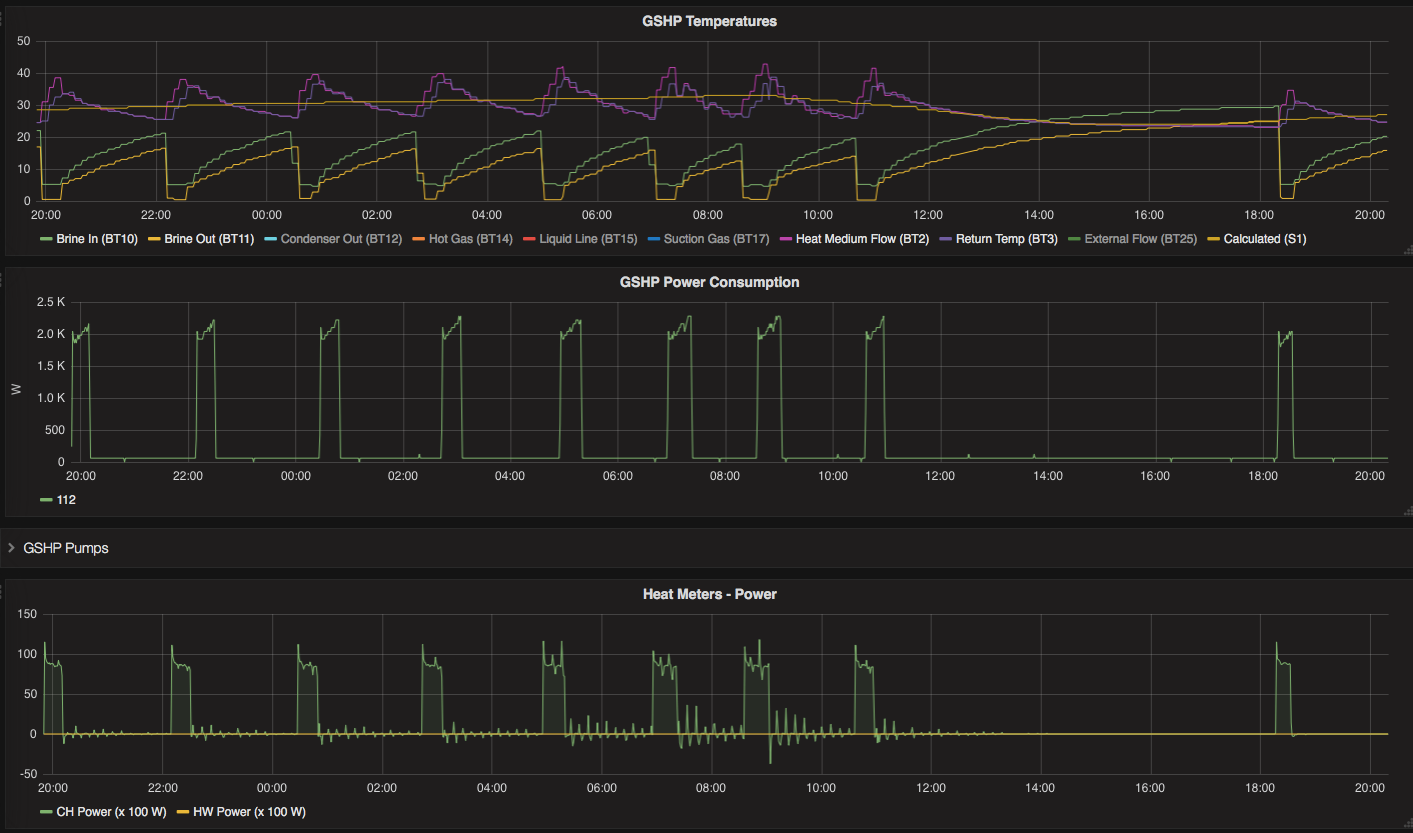
GSHP Performance Graphs for a cold but bright day in February
The second set of graphs (below) show a ‘hot water’ cycle starting at around 2018-02-15T05:00. Note how the increased water delivery temperature (peaking at 55 degrees) corresponds to an increased electricity consumption (peaking at 2.88 kW) while the power output remains steady at 8.0 kW.
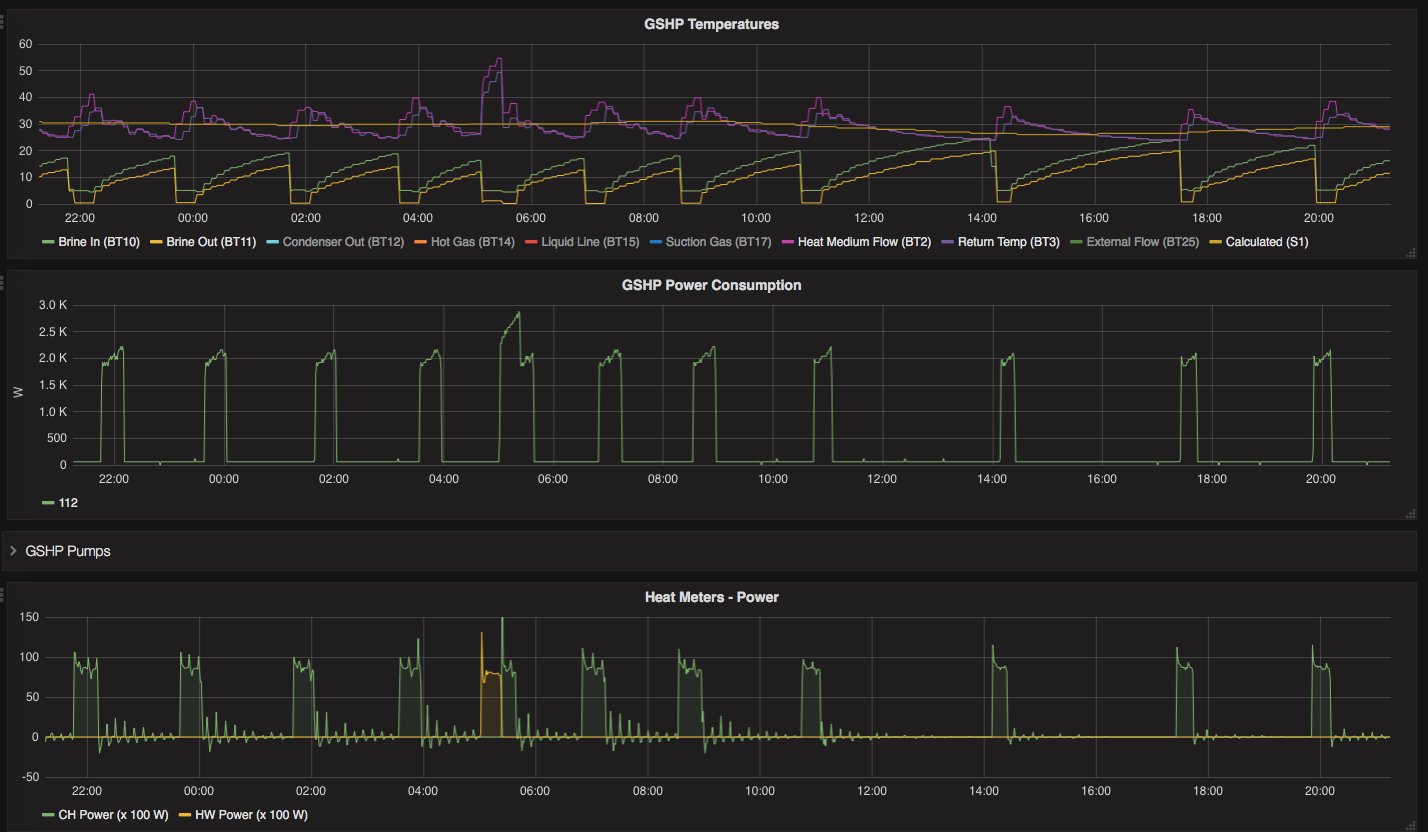
GSHP Performance Graphs for a hot water heating cycle in February
![]() Real-World Heat Pump Efficiency Data – Part 2 by Marsh Flatts Farm Self Build Diary is licensed under a Creative Commons Attribution-ShareAlike 4.0 International License.
Real-World Heat Pump Efficiency Data – Part 2 by Marsh Flatts Farm Self Build Diary is licensed under a Creative Commons Attribution-ShareAlike 4.0 International License.
Hi, interested to see an update, how does average COP over a 24hr period look?
Thanks.
Hi Richard,
Looking at the electricity sub-meter on the heat pump (input) and the heat meters on the CH and HW pipes (output) those are reporting 4.6 kWh input and a total of 17.5 kWh output over the past 24 hours, giving an average COP of 3.8.
It’s not been a bad winter (yet!) so the brine is coming in from the ground loops at 7 degrees and going back at 2 degrees.
David
Great blog, place looks amazing BTW 😉
Hi,
Second time I’ve bumped into your site, and very informative it is too. We have a plot in Scotland that we have planning for, and are at the Building Standards stage now. It’s quite remote (though near the sea and temperate), and a more modest project than yours.
I’m wondering about the slinkies for a ground source heat pump. I’ve had a quote or two, and the heat pump installers like long ones. I, on the other hand, know that the ground is very stony (some BIG rocks) , but that the loam soil at the bottom of the slope has drainage water percolating through it in the winter. Hence I’m hoping that 30m of slinky would be enough for a 4kW heat pump.
I know that it’s impossible to answer, but have you any comments?
One thought I have is to try it, and if the ground starts getting too cold, just use the woodburner more, or try to add another run of slinky at that point.
Just to add, I have an engineering degree (although it’s in electronics).
David B.
Hi David,
Couple of thoughts:
If you’re not going to claim RHI and you’re OK with the idea of digging up the garden again later to extend the ground array, you could just try it and see how things work out – and add another slinky trench if required.
David