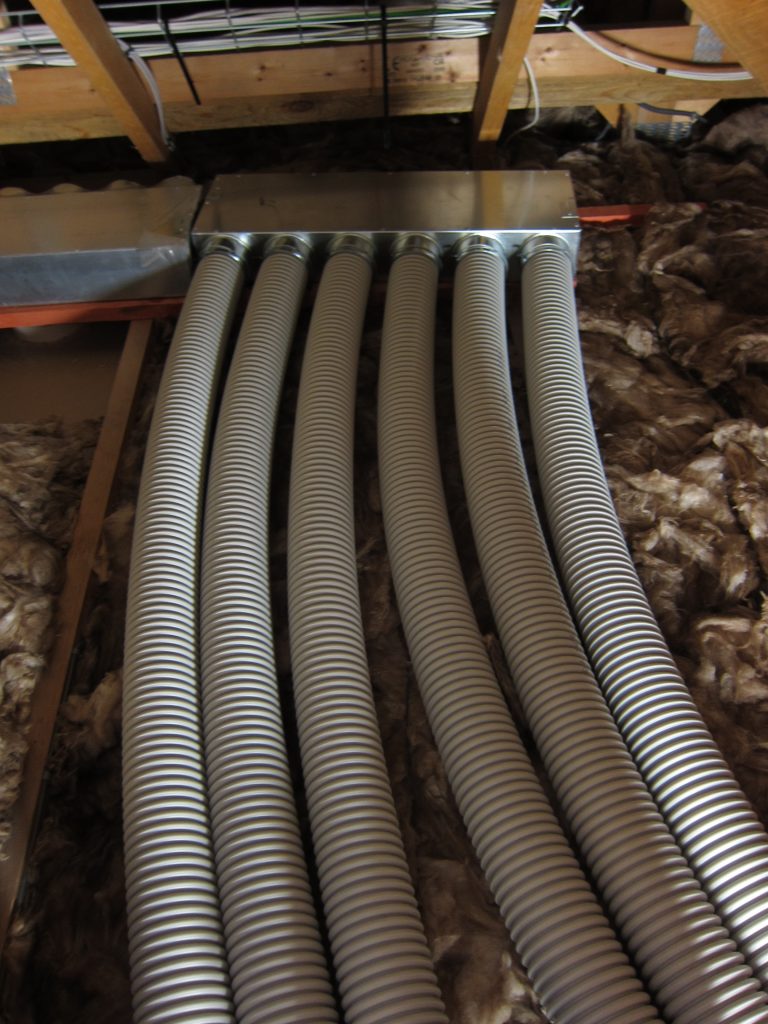
The supplier of the MVHR equipment (BPC Ventilation) prepared a design showing the rough locations of the inlet and extract vents, specifying that each vent should have two 75mm semi-rigid ducts attached (in order to achieve the required airflow – especially given the relatively long duct runs). The detail of the duct routing is left to the discretion of the installer. I settled on locating the vents along the centreline of the workshop then running the ducts on the East side – mostly because the access hatches are just to the West side of the central bracing planks, which form a natural walkway – at least for now, before the rest of the loft insulation gets installed. While the 75mm duct (FRÄNKISCHE profi-air classic grey NW75) specifies a minimum bend radius of only 150mm there is no harm in having much larger radius bends where space allows.
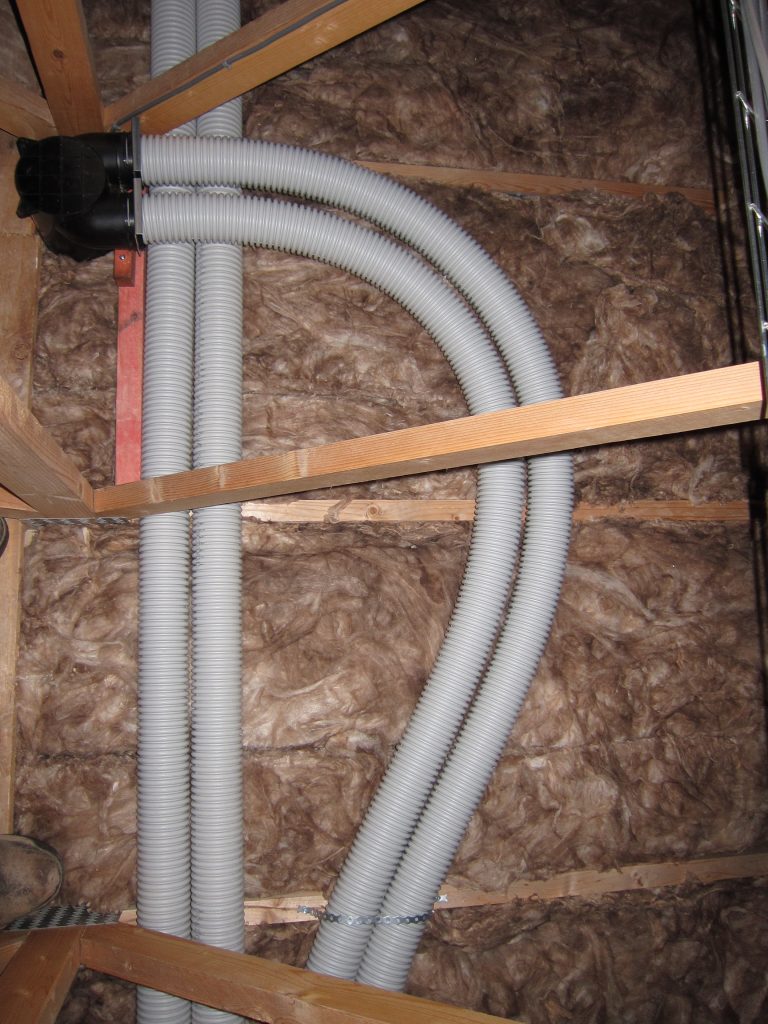
The loft space will be ‘cold’ (deliberately ventilated to the outside) and I initially looked at pre-insulated ductwork but was advised that’s not as good as it might be and the best approach is to install uninsulated ductwork ‘in the middle’ of the loft insulation. The insulation visible in the above photo is a 100mm-thick layer between the ceiling joists and that – together with the grey ducts – will get covered by the additional 170mm of insulation installed on top.
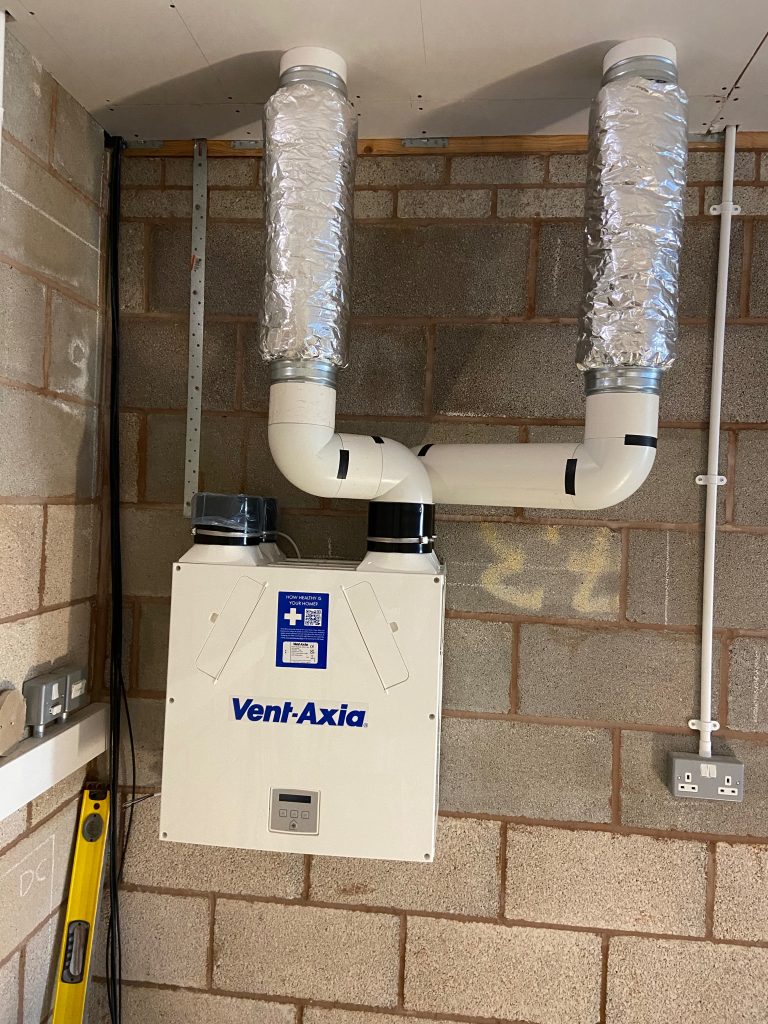
At their other ends, the ducts connect to another plenum chamber adjacent to the MVHR unit.