The static caravan which has been on site since 2014 is on the move. I was gearing up to advertise it more widely when word of mouth brought a buyer to my door. It will be removed from site within the next few days.
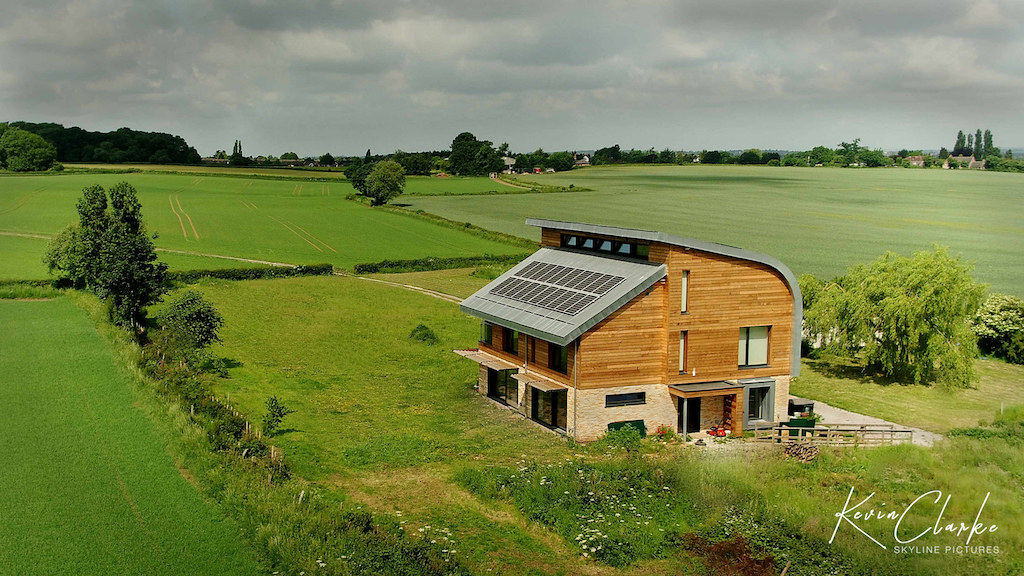
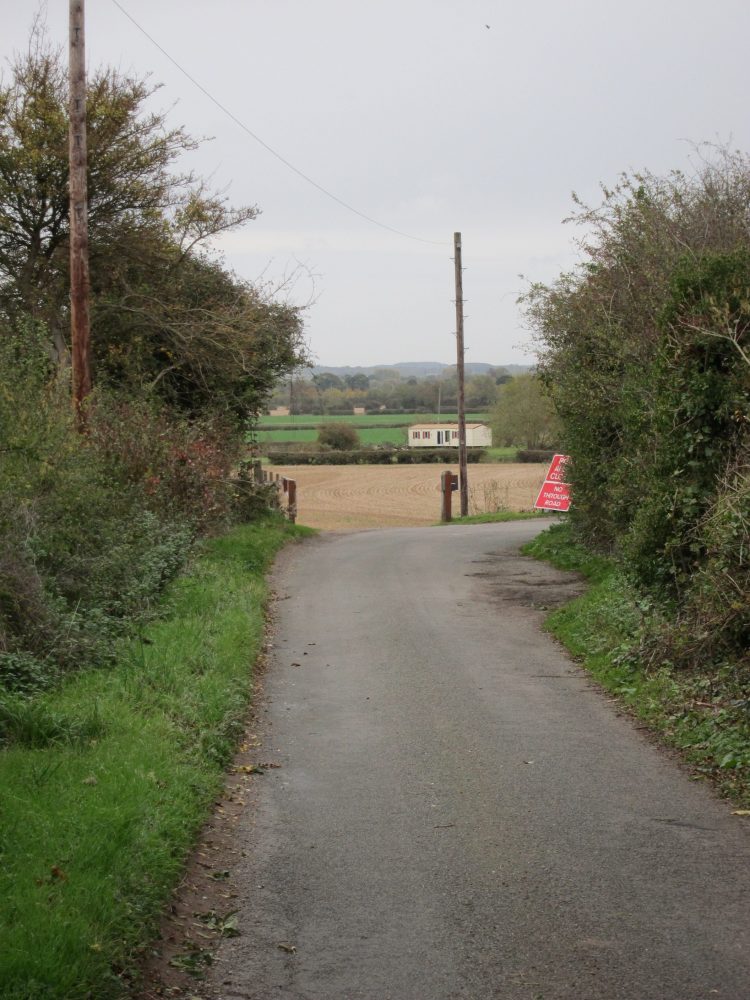
Its pale colour made the caravan quite obvious from Aston Lane (and Snelsmoor Lane) and its location meant it was more visible than the house when approaching the bend by the gate.
Static Caravan from Aston Lane
Once out of the trees, where the view widens up, it was clearly visible alongside the house.
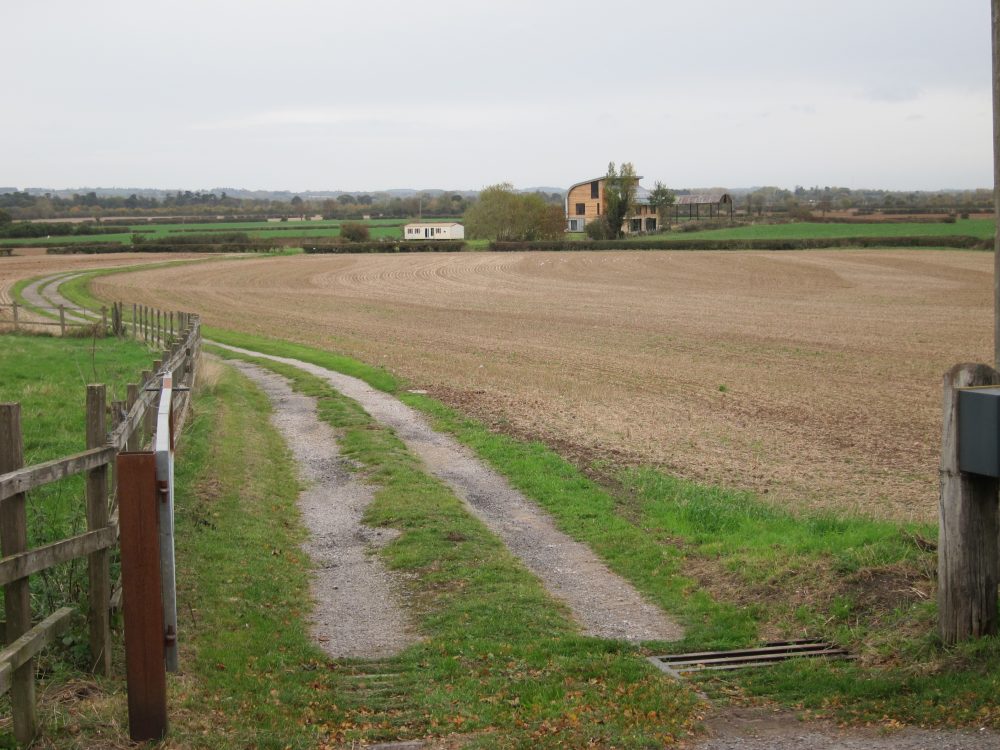
Static caravan from Aston Lane
Closer up, it was more evident the outside was overdue for a good clean, though nothing a bit of pressure-washing can’t fix.
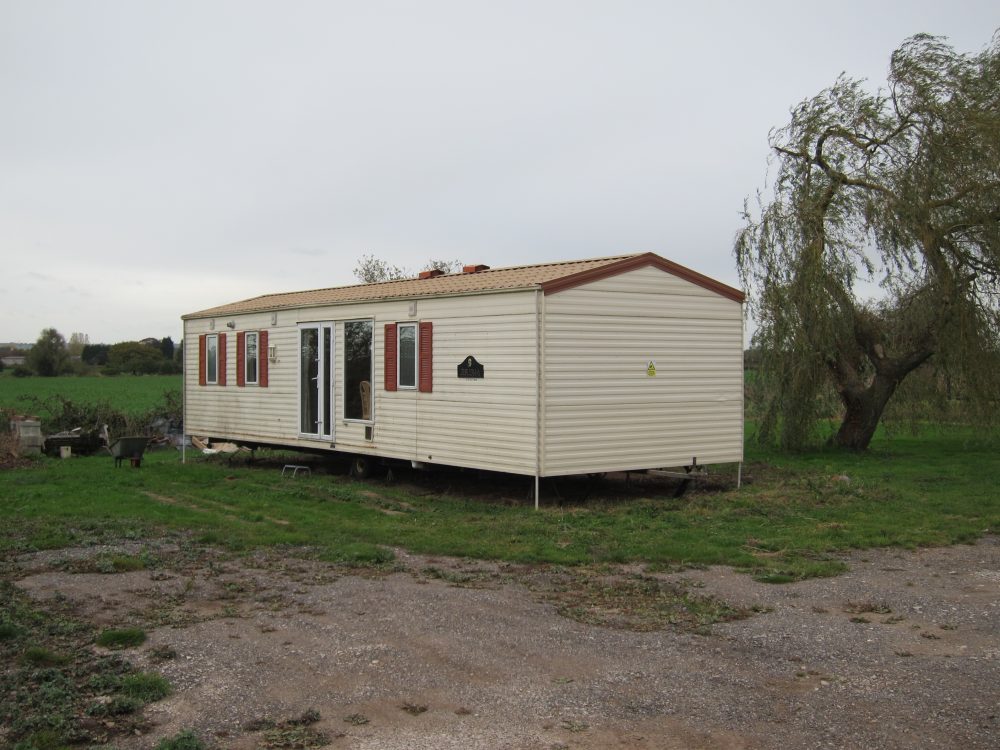
Static Caravan still in situ
These caravans might be called “mobile homes” but they’re only just mobile. They’re firmly optimised for staying in once place for years on end. It proved easy enough to roll it on its wheels across level ground but getting it onto a trailer needs a winch and unless the trailer is specially designed with a straight bed, the under-frame fouls the trailer before the wheels make contact with the ramp so there’s a lot of packing and jacking involved.
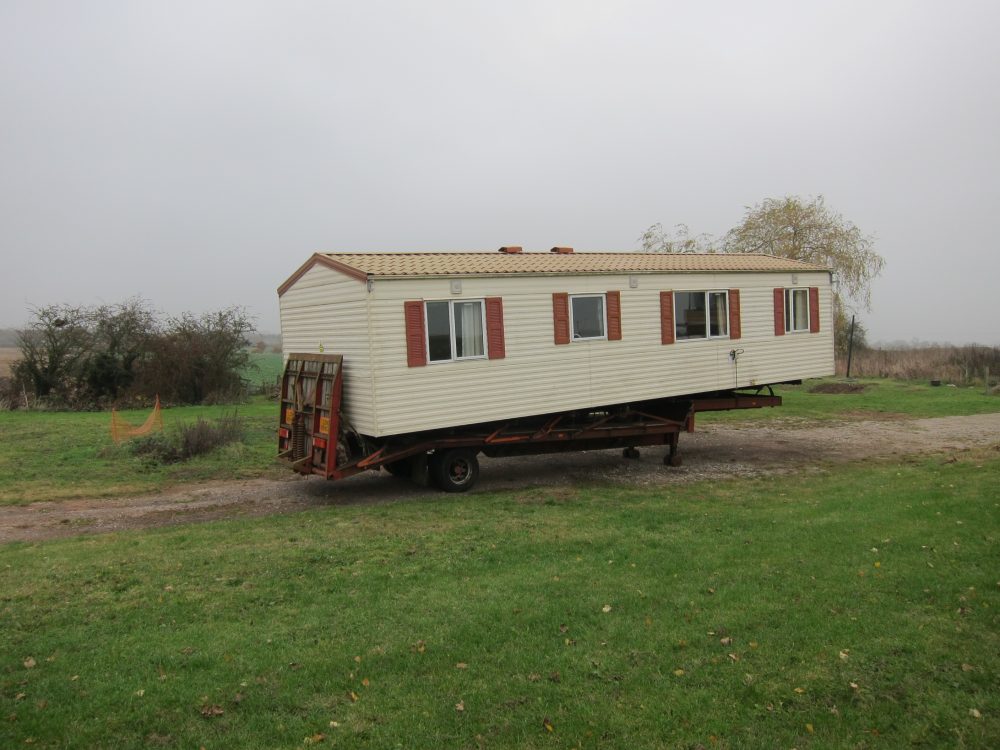
Static Caravan on trailer ready for transport